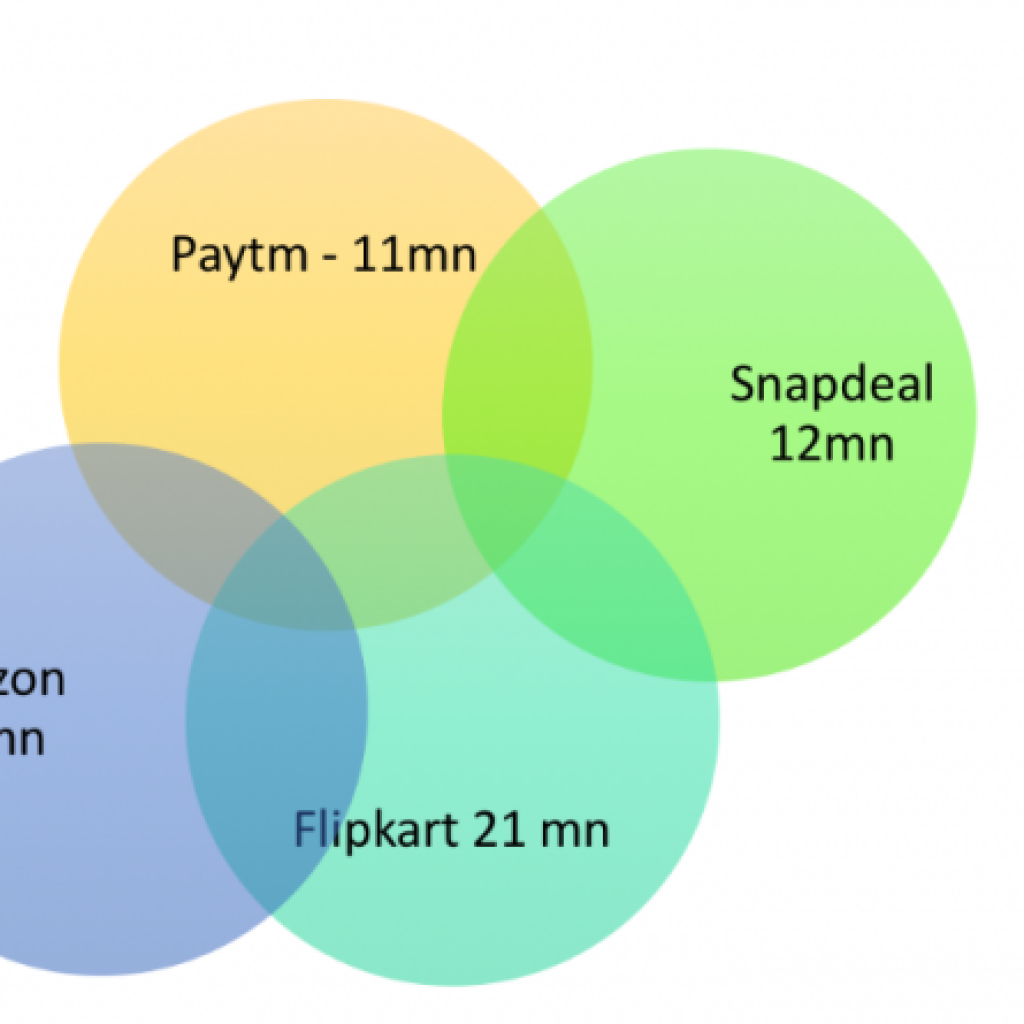
Following up on my last year’s post on Mobile Commerce, I decided to focus only on Big 4 this time primarily due to lack of time. Here is what I published in Dec 2014:
The numbers shown below are based on my formula based on publicly available data. Plus I have used all the free sources of data (non-paid) available from popular App store analytics platforms. The charts below are only for Android, which IMO would be 85% of all App traffic.
Flipkart maintained its leadership in 2015:

Flipkart grew 2x:

Returning users:

Month 2 retention seems to be the biggest concern for all:

Number of days a user stays before attriting:

Amazon has the lowest DAU of all (in millions):

Net Install Base as of today (Total minus uninstalls):

Snapdeal scores the lowest in MAU (in millions):

Clearly Paytm leads the pack as it included recharge orders as well:

Big Billion Day saw Flipkart becoming the no.1 overall App in India beating Whatsapp/Facebook:

Snapdeal also gained during the October sale:

Amazon went aggressive with mobile campaign around May resulting in no.1 position overall:

Paytm seems to be focusing less on vanity metric like App Rank:

